Galaxy Training
Collection of training resources for Galaxy courses - Community Site
Proudly part of


Exome Sequencing Analysis using Galaxy
Background
Exome sequencing (also known as targeted exome capture) is an efficient strategy to selectively sequence the coding regions of the genome as a cheaper but still effective alternative to whole genome sequencing. Exons are short, functionally important sequences of DNA which represent the regions in genes that are translated into protein and the untranslated region (UTR) flanking them. In the human genome there are about 180,000 exons: these constitute about 1% of the human genome, which translates to about 30 megabases (Mb) in length. It is estimated that the protein coding regions of the human genome constitute about 85% of the disease-causing mutations [Choi et al., 2009].
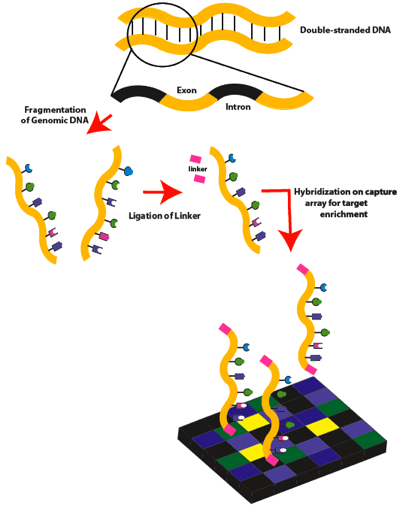
Figure 1. Exome sequencing workflow: Part 1. Double-stranded genomic DNA is fragmented by sonication. Linkers are then attached to the DNA fragments, which are then hybridized to a capture microarray designed to target only the exons.
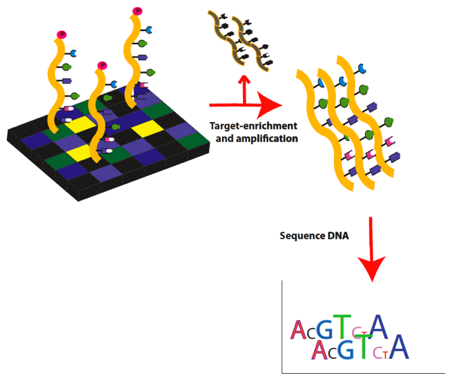
Figure 2. Exome sequencing workflow: Part 2. Target exons are enriched, eluted and then amplified by ligation-mediated PCR. Amplified target DNA is then ready for high-throughput sequencing.
Tutorial
Before starting
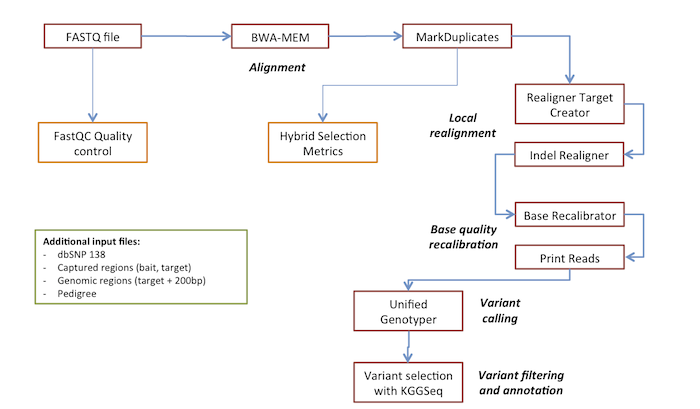
The following table lists the steps of the analysis and the corresponding tools.
| Step | Tool | Description | Section |
|---|---|---|---|
| 1 | FastQC | FASTQ quality control | NGS: Quality control |
| 2 | Map with BWA-MEM | Aligns reads | NGS: Mapping |
| 3 | Mark Duplicate reads | Finds and marks duplicated reads | NGS: Picard |
| 4 | Realigner Target Creator | Defines regions for indel realignment | NGS: GATK2 |
| 5 | Indel Realigner | Local realignment around indels | NGS: GATK2 |
| 6 | Base Recalibrator | Calculates covariates used to recalibrate base quality scores of reads | NGS: GATK2 |
| 7 | Print Reads | Adjust base quality scores using covariates from Base Recalibrator | NGS: GATK2 |
| 8 | Unified Genotyper | Variant calling | NGS: GATK2 |
| 9 | Variant selection with KGGSeq | Variant annotation and filtering | VCF Tools |
Input Files
Our dataset consists in FASTQ reads (Illumina, 100bp paired-end) from a trio composed by healthy consanguineous parents and a child affected by osteopetrosis. Target regions were captured with the Nextera Rapid Capture Expanded Exome kit (62MB). To reduce the computation time, we preselected the reads mapping mostly to chromosome 8.
Input data are also available at Zenodo
Data used in this tutorial:
| Name | Description |
|---|---|
| father_R1.fq | FASTQ forward |
| father_R2.fq | FASTQ reverse |
| mother _R1.fq | FASTQ forward |
| mother_R2.fq | FASTQ reverse |
| proband_R1.fq | FASTQ forward |
| proband_R2.fq | FASTQ reverse |
| hg19_chr8.fa | Reference genome (only chr 8) |
| dbsnp_138.hg19.chr8.vcf | Subset of dbSNP v138 (only chr 8) |
| NexteraRapidCaptureExpandedExome_Target.hg19.chr8.HybridSelection | Target regions for post-alignment statistics |
| NexteraRapidCaptureExpandedExome_Probes.hg19.chr8.HybridSelection | Probe location for post-alignment statistics |
| NexteraRapidCaptureExpandedExome_Target.hg19.chr8.padding200.bed | Regions where the GATK tools should operate, including 200bp padding |
| Pedigree | File with sample relationships |
The output files of each step are also available in Shared data > Data Libraries > Training > Results. If you have trouble running a tool, you can directly download the output files from there.
From raw reads to aligned BAM
Connect to Galaxy and load data
- Connect to http://90.147.170.113
- On the upper panel select Shared Data > Data Libraries > Training > Input
- Select all the files
- Import them to histories -> Destination Histories: -> New history named: e.g.
Workshop: Exome.
Now, on the upper panel click on Analyze data, then click on history’s option on the top of the right menu and select the above-mentioned history among the Saved Histories. Then, in the right panel you will find the imported datasets to use in the next steps of the analysis.
| IMPORTANT | Run steps 1-7 with only one sample |
|---|---|
| For the practical, we suggest to run the steps from 1 to 7 using only one sample (i.e. father, mother or proband). Then, before step 8 (variant calling) you will retrieve the missing BAMs from: Shared Data -> Data library -> Training -> Results -> Print Reads - … |
Step 1 - Quality check
As a first step of the analysis you should always perform a quality control check to ensure that the raw data looks good and there are no problems or biases in your data which may affect your downstream analysis and conclusions.
As an example, check the quality of a couple of your FASTQ files:
- From the left panel select the NGS: quality control -> FastQC: Read Quality Reports tool
- From the drop-down list select one of the FASTQ files
Question:
- Looking at QC results, do you think is it necessary to perform a trimming/filtering step?
Step 2 - Mapping reads with BWA-MEM
The next step is the alignment of the processed reads to the reference genome using BWA-MEM, a fast software package for mapping low-divergent sequences against a large reference genome, such as human.
- From the left panel select the NGS: Mapping -> Map with BWA-MEM tool.
- Align the FASTQ files against the
hg19_chr8.fareference genome selecting it from the history - Single or Paired-end reads: select
Pairedand choose two paired FASTQ files, such as father_R1.fq and father_R2.fq - Set read groups information?: select
Picard style - Add the READ GROUPS (required later by GATK). The sample name used here will be appended to each file and will become critical for the downstream SNP detection step.
The read group name in each BAM file will connect the reads back to individual samples after files have been merged for SNP detection by Unified Genotyper.
An example of READ GROUP for the father’s reads is the following:
- Read group identifier (ID). Ex. Flowcell.Lane.Sample :
FC1.L1.father - Platform/technology used to produce the reads (PL):
ILLUMINA - Library name (LB):
Lib1 - Sample (SM):
father(this will be the column name in the final VCF file)
…and for the mother:
- Read group identifier (ID):
FC1.L1.mother - Platform/technology used to produce the reads (PL):
ILLUMINA - Library name (LB):
Lib2 - Sample (SM):
mother
…and for the proband:
- Read group identifier (ID):
FC1.L1.proband - Platform/technology(PL):
ILLUMINA - Library name (LB):
Lib3 - Sample (SM):
proband
- Read group identifier (ID). Ex. Flowcell.Lane.Sample :
BWA-MEM generates an alignment is a file in SAM format, which is automagically converted in binay BAM format in Galaxy.
From Alignment to Base quality recalibration
Step 3 - Mark duplicates
The MarkDuplicates tool from the Picard suite is important in removing PCR duplicates, which can introduce bias during variant calling. If you did not mark duplicates, you would risk having over-representation in your sequence of areas preferentially amplified during PCR.
One way to think about it is that marking duplicates and removing them does not really have a detrimental effect on your overall depth of coverage, but increases the quality/reliability of the areas you have covered.
Briefly, duplicately sequenced molecules shouldn’t be counted as additional evidence for or against a putative variant. By marking these reads as duplicates the algorithms in the GATK know to ignore them.
This tool takes as input the BAM file and returns a BAM file with the flag modified for duplicated reads.
One of the parameters requires a regular expression to extract from the read name, the tile number within the flowcell lane, x and y coordinates. These values are used to estimate the rate of optical duplication in order to give a more accurate estimated library size.
The regular expression should contain three capture groups, identified by parenthesis, for the three variables (tile number within the flowcell lane, x coordinate and y coordinate).
For example, the header of the FASTQ files used in this practical looks like:
@DCW97JN1:309:C0C42ACXX:4:2206:12976:57510/1
where:
- @DCW97JN1: the unique instrument name
- 309: the run id
- C0C42ACXX: the flowcell id
- 4: the lane id
- 2206: tile number within the flowcell lane
- 12976: x coordinate of the cluster within the tile
- 57510: y coordinate of the cluster within the tile
- /1: the member of a pair, /1 or /2 (paired-end reads only)
then the regular expression is: [a-zA-Z0-9]+:[0-9]+:[a-zA-Z0-9]+:[0-9]:([0-9]+):([0-9]+):([0-9]+).*
Set the parameters as follow:
- DO NOT remove duplicates from output file
- Assume reads are already ordered - faster as it assumes that the BAM is already sorted
- Regular expression for parsing read names:
[a-zA-Z0-9]+:[0-9]+:[a-zA-Z0-9]+:[0-9]:([0-9]+):([0-9]+):([0-9]+).*
Statistics post-alignment
Several tools are available for checking the quality of the library, overall alignment, and exome capture strategy. Here we use the Picard tool SAM/BAM Hybrid Selection Metrics which calculates a set of Hybrid Selection specific metrics from an aligned SAM or BAM file.
| Tool name | Description | Input | Output |
|---|---|---|---|
| SAM/BAM Hybrid Selection Metrics for targeted resequencing data | Compute several statistics for targeted resequencing data (i.e. exome) | Output from MarkDuplicate, files with bait and target regions | File with metrics (% on-target, % off-target, etc) |
Parameters:
- SAM/BAM dataset to generate statistics for: the output BAM file from Mark Duplicates
- Bait intervals: Bait/probe genomic locations:
NexteraRapidCaptureExpandedExome_Probes.hg19.chr8.HybridSelection - Target intervals: Regions targeted by the exome kit:
NexteraRapidCaptureExpandedExome_Target.hg19.chr8.HybridSelection
The output file has the following structure (from Picard Documentation) :
| Field | Description |
|---|---|
| BAIT_SET | The name of the bait set used in the hybrid selection |
| GENOME_SIZE | The number of bases in the reference genome used for alignment |
| BAIT_TERRITORY | The number of bases which have one or more baits on top of them |
| TARGET_TERRITORY | The unique number of target bases in the experiment where target is usually exons etc. |
| BAIT_DESIGN_EFFICIENCY | Target terrirtoy / bait territory. 1 == perfectly efficient, 0.5 = half of baited bases are not target |
| TOTAL_READS | The total number of reads in the SAM or BAM file examine |
| PF_READS | The number of reads that pass the vendor’s filter |
| PF_UNIQUE_READS | The number of PF reads that are not marked as duplicates |
| PCT_PF_READS | PF reads / total reads. The percent of reads passing filter |
| PCT_PF_UQ_READS | PF Unique Reads / Total Reads |
| PF_UQ_READS_ALIGNED | The number of PF unique reads that are aligned with mapping score > 0 to the reference genome |
| PCT_PF_UQ_READS_ALIGNED | PF Reads Aligned / PF Reads |
| PF_UQ_BASES_ALIGNED | The number of bases in the PF aligned reads that are mapped to a reference base. Accounts for clipping and gaps |
| ON_BAIT_BASES | The number of PF aligned bases that mapped to a baited region of the genome |
| NEAR_BAIT_BASES | The number of PF aligned bases that mapped to within a fixed interval of a baited region, but not on a baited region |
| OFF_BAIT_BASES | The number of PF aligned bases that mapped to neither on or near a bait |
| ON_TARGET_BASES | The number of PF aligned bases that mapped to a targetted region of the genome |
| PCT_SELECTED_BASES | On+Near Bait Bases / PF Bases Aligned |
| PCT_OFF_BAIT | The percentage of aligned PF bases that mapped neither on or near a bait |
| ON_BAIT_VS_SELECTED | The percentage of on+near bait bases that are on as opposed to near |
| MEAN_BAIT_COVERAGE | The mean coverage of all baits in the experiment |
| MEAN_TARGET_COVERAGE | The mean coverage of targets that recieved at least coverage depth = 2 at one base |
| PCT_USABLE_BASES_ON_BAIT | The number of aligned, de-duped, on-bait bases out of the PF bases available |
| PCT_USABLE_BASES_ON_TARGET | The number of aligned, de-duped, on-target bases out of the PF bases available |
| FOLD_ENRICHMENT | The fold by which the baited region has been amplified above genomic background |
| ZERO_CVG_TARGETS_PCT | The number of targets that did not reach coverage=2 over any base |
| FOLD_80_BASE_PENALTY | The fold over-coverage necessary to raise 80% of bases in “non-zero-cvg” targets to the mean coverage level in those targets |
| PCT_TARGET_BASES_2X | The percentage of ALL target bases acheiving 2X or greater coverage |
| PCT_TARGET_BASES_10X | The percentage of ALL target bases acheiving 10X or greater coverage |
| PCT_TARGET_BASES_20X | The percentage of ALL target bases acheiving 20X or greater coverage |
| PCT_TARGET_BASES_30X | The percentage of ALL target bases acheiving 30X or greater coverage |
| HS_LIBRARY_SIZE | The estimated number of unique molecules in the selected part of the library |
| HS_PENALTY_10X | The “hybrid selection penalty” incurred to get 80% of target bases to 10X. This metric should be interpreted as: if I have a design with 10 megabases of target, and want to get 10X coverage I need to sequence until PF_ALIGNED_BASES = 10^7 * 10 * HS_PENALTY_10X |
| HS_PENALTY_20X | The “hybrid selection penalty” incurred to get 80% of target bases to 20X. This metric should be interpreted as: if I have a design with 10 megabases of target, and want to get 20X coverage I need to sequence until PF_ALIGNED_BASES = 10^7 * 20 * HS_PENALTY_20X |
| HS_PENALTY_30X | The “hybrid selection penalty” incurred to get 80% of target bases to 30X. This metric should be interpreted as: if I have a design with 10 megabases of target, and want to get 30X coverage I need to sequence until PF_ALIGNED_BASES = 10^7 * 30 * HS_PENALTY_30X |
| AT_DROPOUT | A measure of how undercovered <= 50% GC regions are relative to the mean. For each GC bin [0..50] we calculate a = % of target territory, and b = % of aligned reads aligned to these targets. AT DROPOUT is then abs(sum(a-b when a-b < 0)). E.g. if the value is 5% this implies that 5% of total reads that should have mapped to GC<=50% regions mapped elsewhere |
| GC_DROPOUT | A measure of how undercovered >= 50% GC regions are relative to the mean. For each GC bin [50..100] we calculate a = % of target territory, and b = % of aligned reads aligned to these targets. GC DROPOUT is then abs(sum(a-b when a-b < 0)). E.g. if the value is 5% this implies that 5% of total reads that should have mapped to GC>=50% regions mapped elsewhere |
Questions:
- How many duplicates (percentage) there are marked? [ (1 - PCT_PF_UQ_READS) * 100 ]
- Which is the average bait and target coverage?
- How many target bases present a coverage equal or greater than 30X? [PCT_TARGET_BASES_30X]
Indel realignment
Reads that align on the edges of indels often get mapped with mismatching bases that might look like evidence for SNPs. Local realignment serves to transform regions with misalignments due to indels into clean reads containing a consensus indel suitable for standard variant discovery approaches. Unlike most mappers, this tool uses the full alignment context to determine whether an appropriate alternate reference (i.e. indel) exists.
This analysis consists in a 2-steps procedure:
- NGS: GATK2 -> Realigner Target Creator: Determining (small) suspicious intervals which are likely in need of realignment
- NGS: GATK2 -> Indel Realigner: Running the realigner over those intervals
Step 4 - Realigner Target Creator
Creates a file with the regions to be realigned. Here we will only select the BAM file, but additional files can be provided (e.g. VCF files included in the GATK Bundle with validated indels).
Input files:
- Choose the reference genome from the history:
hg19_chr8.fa - The BAM file from the Mark Duplicates step
- Choose the bed file with target regions: add
NexteraRapidCaptureExpandedExome_Target.hg19.chr8.padding200.bedin Advanced GATK options -> Operate on genomic interval
Step 5 - Indel Realigner
Input files:
- Choose the reference genome from the history:
hg19_chr8.fa - The BAM file from the Mark Duplicates step
- Intervals provided by Realigner Target Creator to restrict the realignment
Step 6 - Base Recalibrator
This tool is designed to work as the first pass in a two-pass processing step. It operates only at sites that are not in dbSNP and assumes that all reference mismatches - absent in dbSNP - are therefore errors and indicative of poor base quality. Then generates tables based on various user-specified covariates (such as read group, reported quality score, cycle, and context). Since there is a large amount of data one can then calculate an empirical probability of error given the particular covariates seen at this site, where p(error) = num mismatches / num observations.
The output file is a table of the several covariate values, num observations, num mismatches, empirical quality score.
Note: ReadGroupCovariate and QualityScoreCovariate are required covariates and will be added for the user regardless of whether or not they were specified.
Input files:
- Choose the reference genome from the history:
hg19_chr8.fa - the BAM file from the Indel Realigner
- add a “Known Variants” >
dbsnp_138.hg19.chr8.vcf - Choose the bed file with target regions: add
NexteraRapidCaptureExpandedExome_Target.hg19.chr8.padding200.bedin Advanced GATK options -> Operate on genomic interval
Step 7 - Print reads
Given a BAM file, it writes a BAM with recalibrated base qualities as output.
Input files:
- Covariates table recalibration file from Base Recalibrator
- Choose the reference genome from the history:
hg19_chr8.fa - The BAM file from the Indel Realigner
- Choose the bed file with target regions: add
NexteraRapidCaptureExpandedExome_Target.hg19.chr8.padding200.bedin Advanced GATK options -> Operate on genomic interval
Variant calling and annotation
You now have an analysis-ready BAM file (deduped, indel-realigned, and recalibrated) for the sample.
Before the multi-sample variant calling you need to retrieve the BAM for the other samples you have not analyzed:
- Import from Data Libraries -> Training -> Results the missing BAM files obtained with Print Reads. E.g: if you analyzed the FASTQ from the proband, you only need to copy the BAM of the parents.
Step 8 - Unified Genotyper
BAM files from Print Reads will be used all together for a multi-sample calling with the NGS: GATK2 -> Unified Genotyper. We will use GATK Unified Genotyper instead of GATK HaplotypeCaller (preferred) in order to reduce computation time. However, the same procedure described here can be used for GATK HaplotypeCaller.
Run the tool for the three samples with the following parameters:
- Choose the reference genome from the history:
hg19_chr8.fa - The father, mother and proband
BAMfrom Print Reads step - In Provide a dbSNP Reference-Ordered Data (ROD) file, select
dbsnp_138.hg19.chr8.vcf - Choose the bed file with target regions: add
NexteraRapidCaptureExpandedExome_Target.hg19.chr8.padding200.bedin Advanced GATK options -> Operate on genomic interval
This tool will produce a raw VCF file with the variants (SNP and INDELs).
Questions:
- How many variants are called? [TIP: expand the Unified Genotyper VCF in the history]
Step 9 - Variant selection with KGGSeq
Uses KGGSeq software to filter and prioritize variants. KGGSeq is able to annotate and filter variants according to multiple criteria (i.e. variant quality, gene feature, allele frequency, genetic inheritance). A description of different parameters is available at the KGGSeq documentation.
Input files:
- VCF file from Unified Genotyper
- Pedigree file
Parameters -> choose your own parameters among:
- variant quality filters
- genotype quality filters
- genetic inheritance
- gene feature filters
- common variants filters
- variant type, region and gene filtering
- functional impact filters
- Add annotations
Questions:
- Which variants have been selected? Check the Variant selection tabular output
- Which is the impact of the different criteria on the final number of variants? Check the Variant selection log file
Display results at UCSC
Once identified a group of putative variants, display on UCSC your results:
- Expand in the history a processed BAM (e.g. the output of Print Reads for the proband) and upload it on UCSC by clicking display at UCSC main. You can upload all the trios BAM files in the same way.
- Insert the candidate gene name in the search field on the top of the page, or even better the chromosome and the StartPosition showed in the Variant selection tabular output
- On the UCSC page, in the Custom Tracks menu, set
fullfor each of the 3 tracks and click onrefreshto get an idea about the coverage in that region and visualize the candidate variant.
References
- Choi M, Scholl UI, Ji W, Liu T, Tikhonova IR, Zumbo P, Nayir A, Bakkaloğlu A, Ozen S, Sanjad S, Nelson-Williams C, Farhi A, Mane S, Lifton RP (10 November 2009). “Genetic diagnosis by whole exome capture and massively parallel DNA sequencing”. Proc Natl Acad Sci U S A 106 (45): 19096–19101
- GATK Best practices
- KGGSeq Manual